
IT and network analytics
Know exactly how every live event is performing, in real time and after.
Hive IT & Network Analytics turns your streaming environment from a black box into complete clarity. Track quality across every location, device, browser, and network segment, build the dashboards you need, and act on what you find.
Is your video stream performing the way you think?
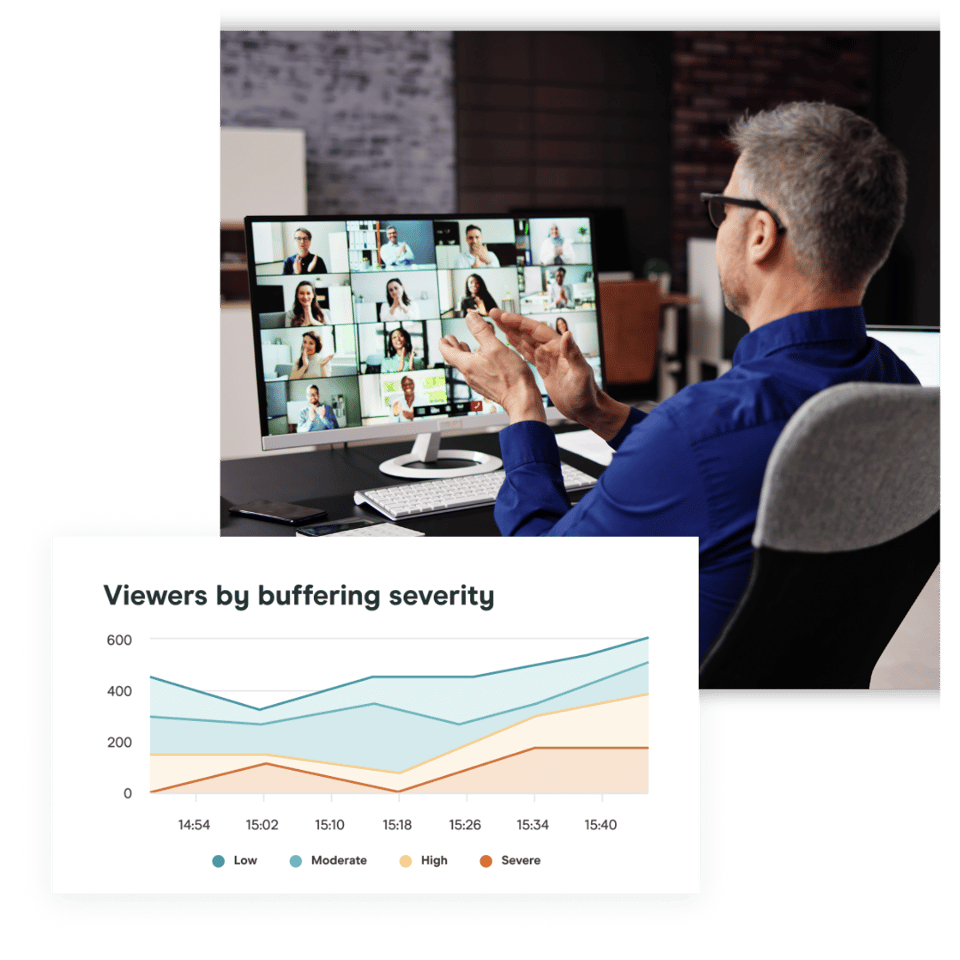
"Buffering spikes at some offices dropped event quality. By the time we noticed, viewers were already disengaged."
- Head of IT, Multinational Enterprise
In most enterprises, live video streaming is a black box. You know when something goes wrong but not why, or how to prevent it from happening again.

See every detail of your webcast performance
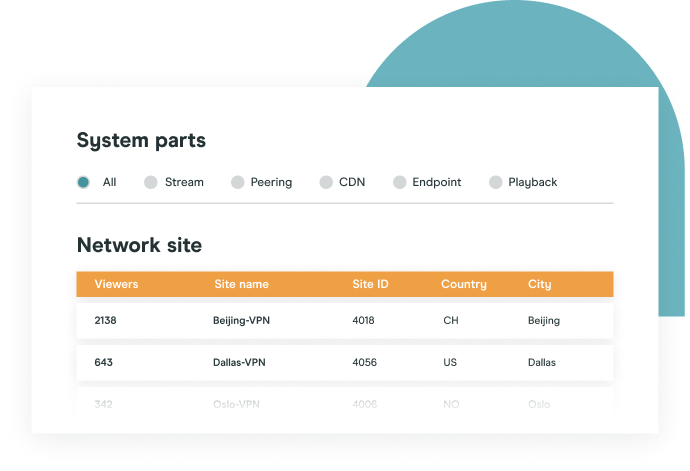
Hive IT & Network Analytics gives you the full picture. From the first frame to the last, you see exactly how your webcast is performing across every location, device, browser, and network segment. That means no more guessing, no more frustrating support tickets, and no more audience-impacting surprises.
Everything you need for proactive webcasting health

Real-time anomaly detection

Deep diagnostics

Historical trends & recurring issue detection

ROI insights

Full coverage across events and time
Actionable analytics for proactive IT & Network teams
Hive IT & Network Analytics equips your IT, network, and event teams with actionable data to:
- Pinpoint underperforming sites before they cause problems
- Detect network or configuration issues in real time
- Validate the impact of infrastructure upgrades
- Benchmark performance across different business units or geographies

How some of the world’s biggest brands use IT & Network Analytics

Preventing CDN overload
Visualize traffic, anticipate congestion, and distribute load before viewers notice

Mitigating bandwidth constraints
Identify lagging locations and allocate resources strategically

Optimizing high-stakes events
Apply proven fixes from past performance data to deliver flawless streams
Take charge of your webcast health now
Replace streaming guesswork with real-time clarity and ensure every viewer gets the reliable experience they expect.
